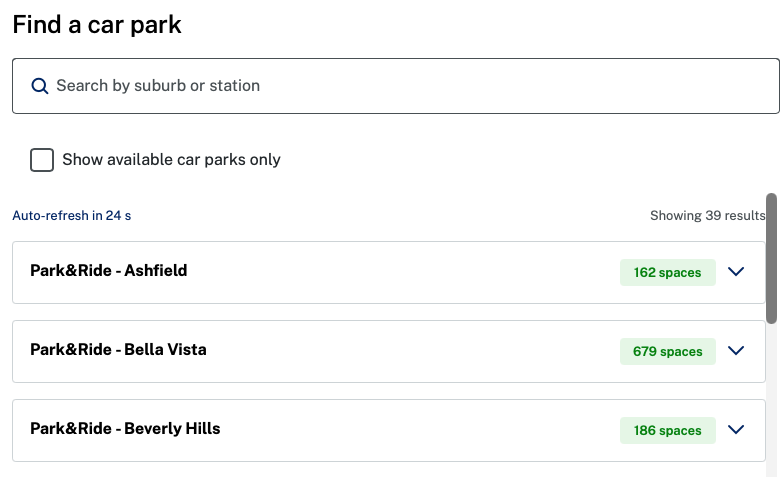
- Problem: The Transport for NSW website provides real-time data on the number of available spots at Park&Ride car parks at any given point in time. However, it's still unclear when these car parks typically fill up.
- Solution: Build an automated pipeline to analyse historical occupancy data and identify typical capacity trends.
- High-level pipeline:
- Collect real-time occupancy data via the TfNSW Car park API throughout the day (every 10 min between 5am-10pm) and store in CSV files.
- Once per week, analyse the historical data to calculate insights for each car park (e.g., average available spots at different times of the day), which are stored in a JSON file.
- Generate visualisations based on the insights data, which are presented in the tool.
- Project repo: https://github.com/nathanwangly/nsw-park-ride-tracker.
Background: The problem to be solved
Sydney’s ‘Park&Ride’ car parks offer all-day parking near train stations for public transport users. Unsurprisingly, these car parks are popular with commuters - and fill up quickly.
Occasionally, I will find myself in a situation where it would be convenient to park at my nearest Park&Ride car park. Particularly if it’s a weekday, I worry about whether there will be any spots available by the time I arrive. While the Transport for NSW website shows you real-time data on how many spots are still available, the problem is that availability can change between checking and arriving - what if the spots are gone by the time I get there?
In the past, I would just avoid the stress by making less convenient travel plans that didn’t involve the Park&Ride car park. But it got me thinking: could I track the real-time data to estimate when the car parks typically fill up by?
Step 1: Sourcing and storing the data
As it turns out, Transport for NSW has a Car park API that allows you to request a car park’s occupancy data at that point in time. Each car park updates its data at a different frequency (e.g., some every 15s, some every 60s, others every 10 min).
I started with fetch_occupancy_data.py to pull key data from the API: timestamps, car park IDs, and availability.
As part of the script, the data is stored in CSV files that are organised into YYYY-MM formats (e.g., 2026-02.csv) to avoid any one file becoming too large.
Step 2: Deciding what insights are needed
I worked backwards from my end goal to determine which insights were actually necessary. To keep things simple, I focused on three goals:
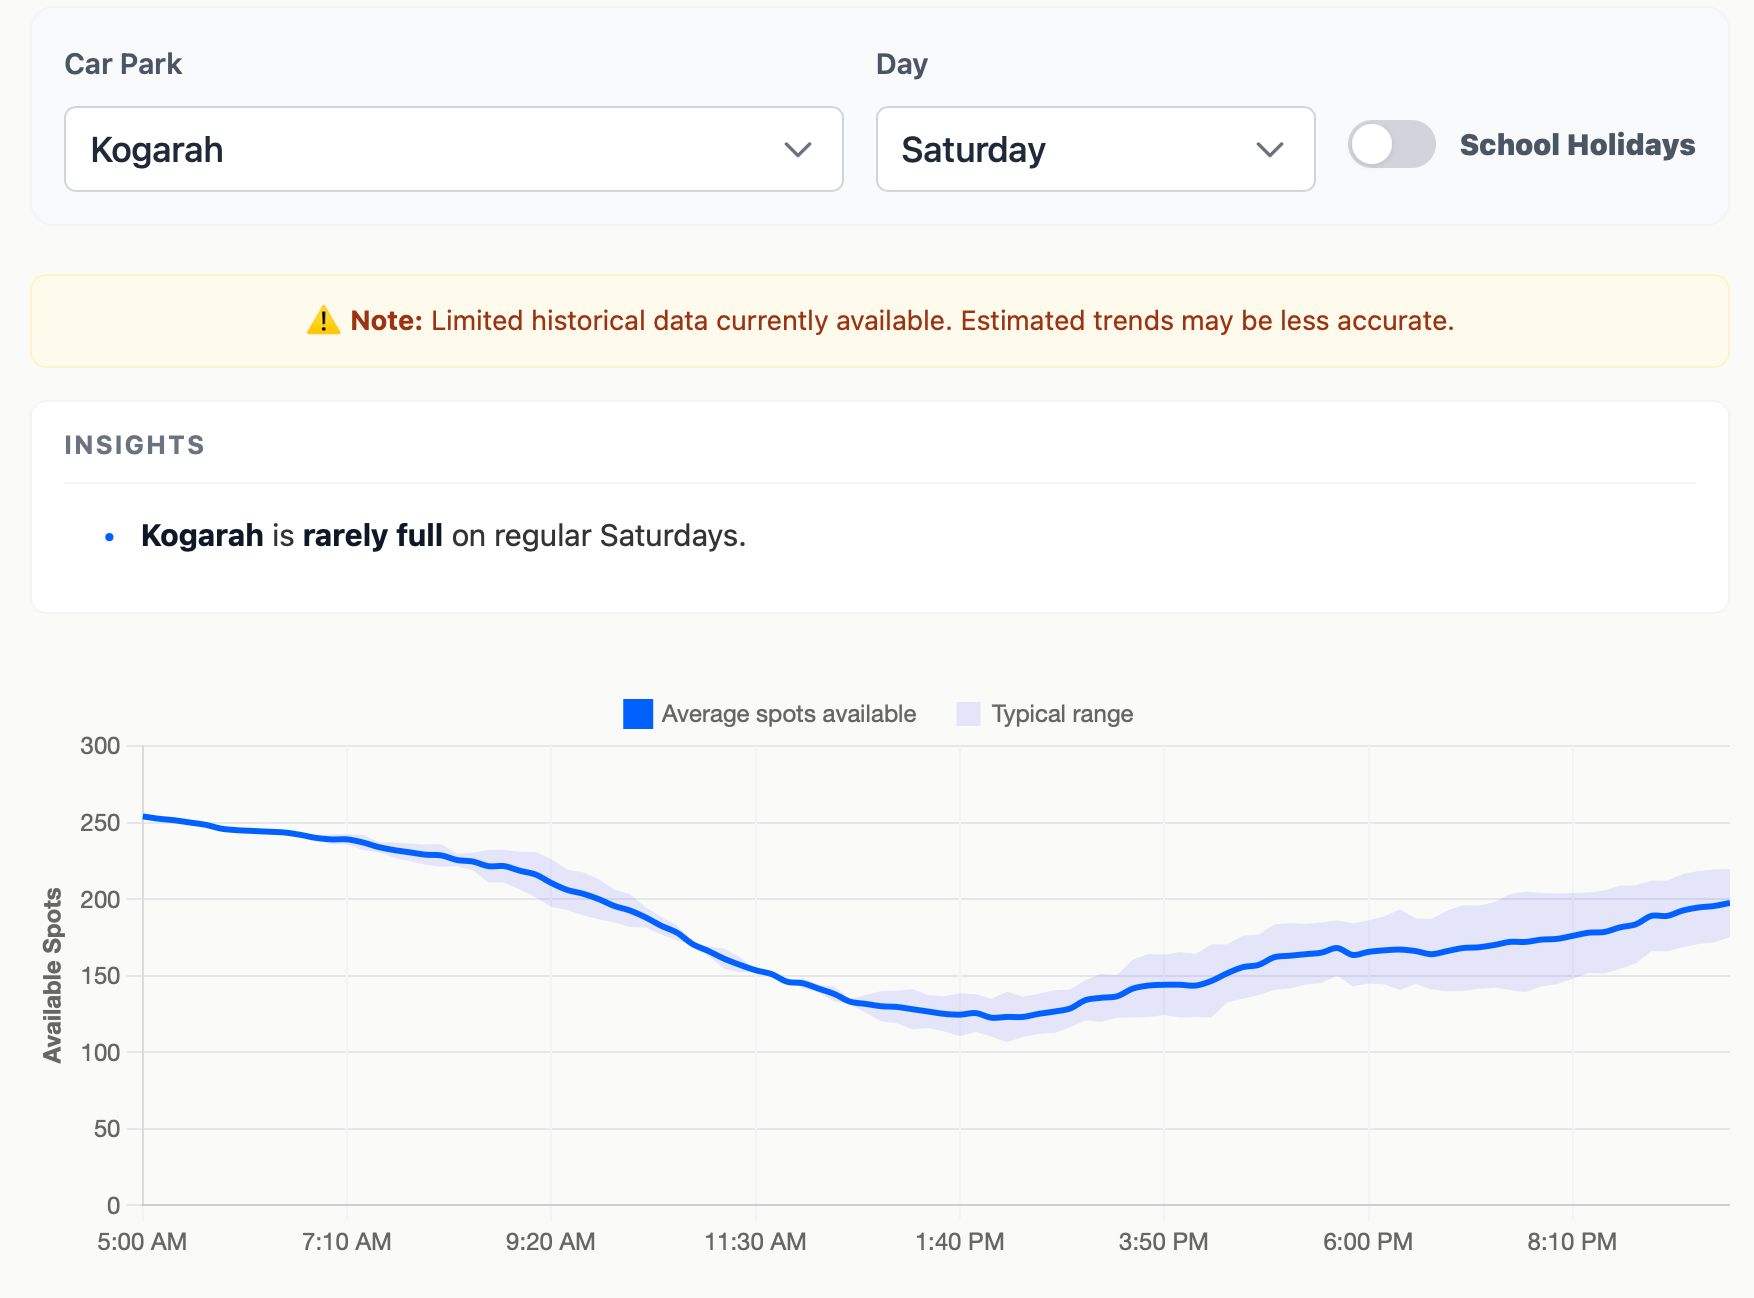
- For each carpark, display average available spots throughout the day with the ability to also visualise uncertainty/variance.
- For each carpark, also indicate when it typically becomes full and when spots tend to become available again.
- Achieve #1 and #2 while considering differences between days of the week (e.g., Fridays are likely quieter) as well as school holiday periods.
Step 3: Processing the raw data
With a clear set of goals in mind, I created two scripts to get from raw data to insights.
First, process_raw_data.py merges the raw CSV files and cleans the data. This includes:
- Filtering out invalid rows (e.g., number of occupied spots occasionally shows up as negative).
- Converting timestamps from UTC to Sydney time, and allocating them to 10-min bins.
- Checking whether the timestamp is within the school holiday period (checking against a manually updated JSON file).
- Calculating aggregate statistics for each unique key: car park x day of week x time bin x regular vs school holiday.
In calculating the aggregate statistics, the script also weights recent observations more heavily (λ = 0.96 per month). This weighting ensures the model adapts quickly to changes, like a car park expansion.
The aggregate statistics are then stored in a master_stats.csv file.
Step 4: Generating and presenting the insights
The next step was to create a generate_insights.py script that would convert the aggregate statistics into insights data that could be used for data visualisation.
The script calculates the mean number of available spots and the standard error for confidence intervals.
In addition to this, the script calculates the ‘typical’ time that each car park becomes full or starts to empty on a given day.
- Becomes full: What is the earliest time that a car park is full (in >80% of observations)?
- Starts to empty: If a car park typically does fill up, what is the earliest time that the car park has >5 spots become available again (in >80% of observations)?
These insights are all stored in an insights.json file that is used to generate the Park&Ride Availability Predictor Tool.
Step 5: Automate the process
The final step was to automate the pipeline so that data would accumulate on its own and the predictions would become more accurate over time.
To automate things, I used a combination of Cron-job.org and Github Actions.
| Frequency | Task | Tool |
|---|---|---|
| Every 10 min between 5am-10pm | Call the TfNSW API using fetch_occupancy_data.py and store the updated data in a data-storage branch. |
Cron-job.org |
| Daily, around midnight | Merge the data-storage branch into the main branch to add in the new day’s data. |
Github Actions |
| Weekly, around Monday midnight | Run the data processing pipeline (process_raw_data.py and generate_insights.py) to produce an updated insights.json file for the tool. |
Github Actions |
(Note: I originally started by trying to use Github Actions to call the API every 10 minutes. However, I found that the timing was unreliable, which led to poor data collection and resulted in me switching over to Cron-job.org).
Final reflections
The code itself wasn’t the hard part — it was finding the balance between planning carefully versus getting started quickly and iterating over time. Because the project’s value depends on accumulating data over time, there was real pressure to get going as soon as possible. But starting without thinking things through risked throwing out weeks of collection midway. I learned this the first time around - a design decision I hadn’t properly thought through cost me a few days of data before I caught it and restarted.
Working with an API and setting up automated workflows were also new territory for me — the kind of thing I might have written off as too complicated before AI tools made it easier to pick up on the fly. A project that took roughly two weeks might otherwise have taken months to get off the ground.
I now have the tool I was after. Its predictions should only get more reliable as the dataset grows — which gives me something to look forward to each time I open it.